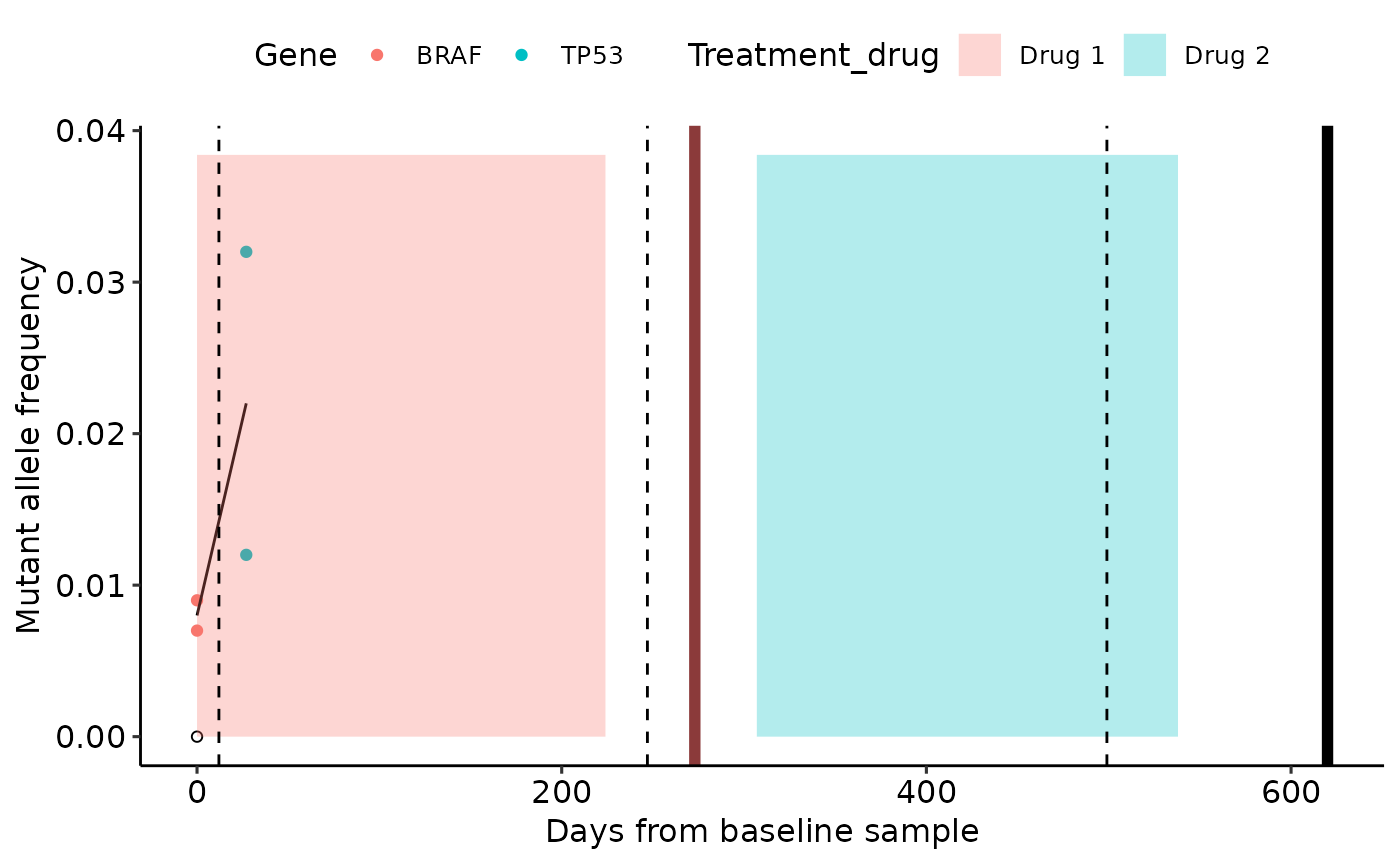
Visualize longitudinal data
gglongi.RdVisualize longitudinal data
Usage
gglongi(
  data,
  x_val,
  y_val,
  col_val,
  col_legend = TRUE,
  mean_line = TRUE,
  x_title = x_val,
  y_title = y_val,
  treatments = NA,
  scans = NA,
  events = NA,
  treatment_start,
  treatment_end,
  treatment_drug,
  scan_date,
  event_date
)
Arguments
- data
The
data.framecontaining the data to be used for the visualization- x_val
A
stringreferring to the name of the column to be visualized on the X axis.- y_val
A
stringreferring to the name of the column to be visualized on the Y axis.- col_val
A
stringreferring to the name of the column to be used to color the points on the plot.- col_legend
A
booleanvalue. IfTRUE, the color legend will be displayed.- mean_line
A
booleanvalue. IfTRUE, the mean values per time point will be calculated and added as a continuous line.- x_title
A
stringto be used as label for the X axis.- y_title
A
stringto be used as label for the X axis.- treatments
A
data.framecontaining treatment information. It should have 3 columns:a column containing the name of the drug
a column containing the time information for the start of treatment
a column containing the time information for the end of treatment
- scans
A
data.framecontaining information about scan dates. It should contain a column denoting the time for each scan.- events
A
data.framecontaining information on clinical events. It should contain the type of event and the associated timing for the event.- treatment_start
A
stringreferring to the name of the column containing the treatment start data.- treatment_end
A
stringreferring to the name of the column containing the treatment end data.- treatment_drug
A
stringreferring to the name of the column containing the treatment drug.- scan_date
A
stringreferring to the name of the column containing the scan date in thescansdata frame.- event_date
A
stringreferring to the name of the column containing the event date in theeventsdata frame.
Examples
mafs <- data.frame(time_from_baseline = c(0, 0, 0, 27, 27),
                   MAF = c(0, 0.009, 0.007, 0.012, 0.032),
                   Gene = c('BRAF', 'BRAF', 'BRAF', 'TP53', 'TP53'))

treatment = data.frame(Treatment_drug = c('Drug 1', 'Drug 2'),
                       start_from_baseline = c(0, 307),
                       stop_from_baseline = c(224, 538))

scans = data.frame(Scan_num = c(1, 2, 3),
                   Days_from_baseline = c(12, 247, 499))

clinical_events = data.frame(Event = c('Progression', 'Death'),
                             Days_from_baseline = c(273, 620))

gglongi(mafs, x_val = "time_from_baseline", y_val = "MAF", col_val = "Gene",
        col_legend = TRUE, mean_line = TRUE, x_title = "Days from baseline sample",
        y_title = "Mutant allele frequency", treatments = treatment, scans = scans,
        events = clinical_events, treatment_start = "start_from_baseline",
        treatment_end = "stop_from_baseline", treatment_drug = "Treatment_drug",
        scan_date = "Days_from_baseline", event_date = "Days_from_baseline")
