Volcanoplotter
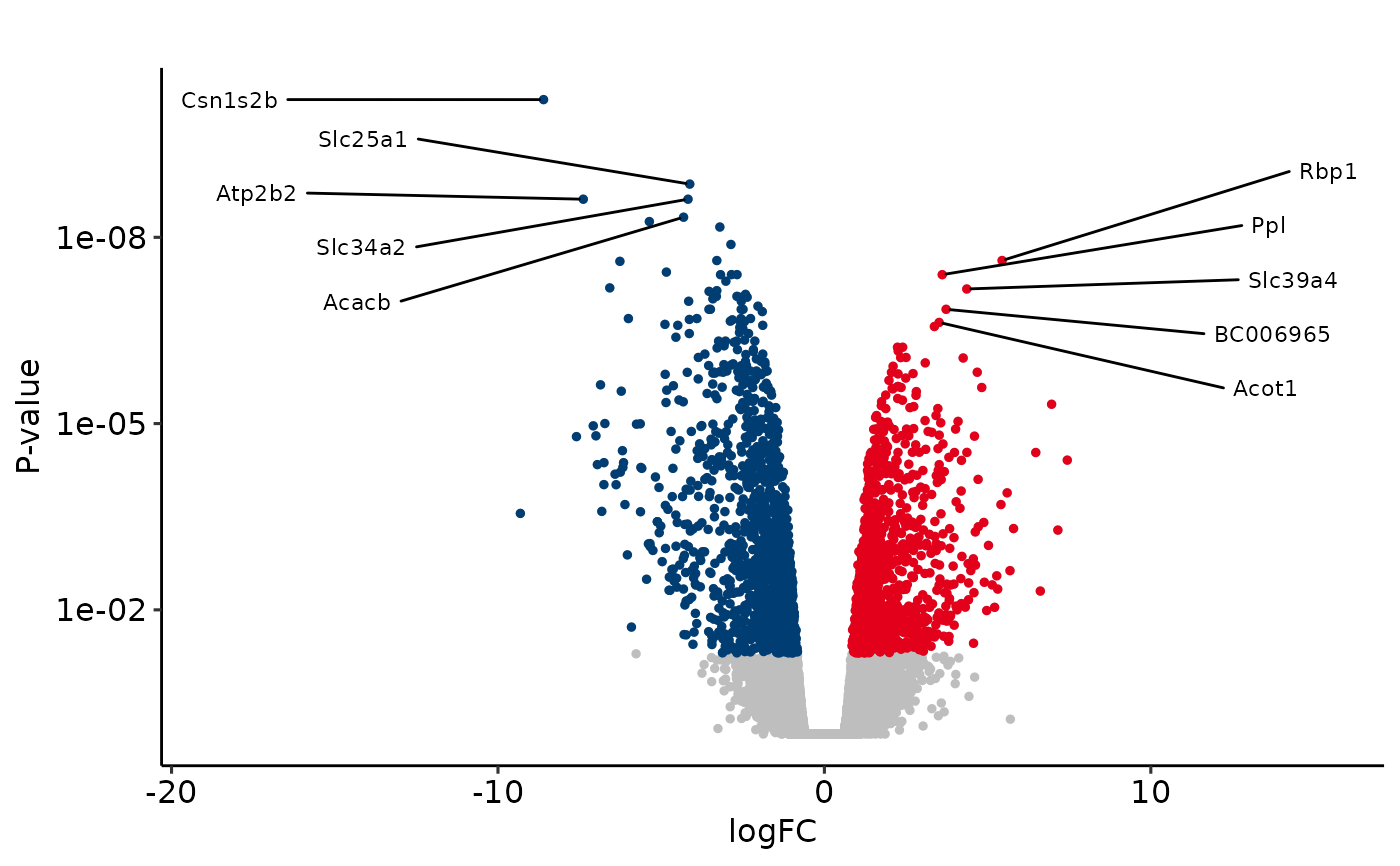
volcanoplotter.RdEnables convenient visualization of differential expression data.
Usage
volcanoplotter(
  data,
  x_val,
  y_val,
  nonsig_col = "grey",
  pointsize = 1,
  point_alpha = 1,
  y_lab = "P-value",
  x_lab = "logFC",
  title = "",
  sig_neg_col = au_colors("blue"),
  sig_pos_col = au_colors("red"),
  pval_cutoff = 0.05,
  add_labels = FALSE,
  num_lab = 10,
  label_col = NA,
  lab_size = 3,
  dirs = "y",
  nudge_x1 = 10,
  nudge_x2 = -10,
  nudge_y1 = 0,
  nudge_y2 = 0,
  lab_bordersize = NA,
  fillcol = scales::alpha(c("white"), 0),
  brk = ggplot2::waiver(),
  lim = NULL,
  ...
)
Arguments
- data
The
data.frameto be used for the visualization.- x_val
string, the name of the column to plot on the x axis.
- y_val
string, the name of the column to plot on the y axis.
- nonsig_col
string, the color to use for the nonsignificant points. Default is
grey.- pointsize
num, point size passed into
geom_point(). Default is1.- point_alpha
num, point opacity passed into
geom_point(). Default is1.- y_lab
string, the y axis label. Default is
P-value.- x_lab
string, the x axis label. Default is
logFC.- title
string, the title of the plot to be displayed on top. Default is
"".- sig_neg_col
string, color to use for the significant negative points. Default is
au_colors("blue").- sig_pos_col
string, color to use for the significant positive points. Default is
au_colors("red").- pval_cutoff
num, significance cutoff. Default is
0.05.- add_labels
boolean, if
TRUE, the number of points determined bynum_labare labelled. Default isFALSE.- num_lab
num, the number of points to label on the plot. Default is
10.- label_col
string, name of the column to use for labelling. Default is
NA.- lab_size
num, size of the labels. Default is
3.- dirs
string, direction of position adjustment passed into
geom_label_repel(). Possible values arex,yandboth. Default isx.- nudge_x1
num, horizontal adjustment of the positive significant labels. Default is
10.- nudge_x2
num, horizontal adjustment of the negative significant labels. Default is
-10.- nudge_y1
num, vertical adjustment of the positive significant labels. Default is
0.- nudge_y2
num, vertical adjustment of the negative significant labels. Default is
0.- lab_bordersize
num, width of the label border. Default is
NA.- fillcol
string, background color for the labels. Default is transparent.
- brk
vector, list of y-axis breaks.
- lim
vector, y-axis limits.
- ...
other parameters passed into
geom_label_repel().