Create scatterplots
scatterplotter.RdEnables the creation of scatterplots in a convenient and customizable manner. Additionally, it allows the user to calculate a correlation metric of interest, and fit a linear or loess line to the data.
Usage
scatterplotter(
  data,
  x_val,
  y_val,
  col_val = NA,
  style = "light",
  colors = NA,
  y_lab = y_val,
  x_lab = x_val,
  title = "",
  legend_lab = "",
  fit = "none",
  discrete = TRUE,
  linecolor = "black",
  pointcolor = "black",
  corr_method = "pearson",
  alternative = "two.sided",
  fit_method = "glm",
  se = FALSE,
  labels = NA,
  formula = "y ~ x",
  pointsize = 1,
  point_alpha = 1,
  display_n = T,
  facet_val = NA,
  ...
)
Arguments
- data
The
data.frameto be used for the visualization.- x_val
string, the name of the column to plot on the x axis.
- y_val
string, the name of the column to plot on the y axis.
- col_val
string, name of the column to use for coloring points. Default is
NA.- style
string, palette style to be used for
scale_color_au. Default islight. Style is only applied ifcolorsremainsNA.- colors
vector containing the colors to be used for the
fillaesthetic. Default isNA. If unspecified, the function usesau_colors().- y_lab
string, the y axis label. Default is the string passed into
y_val.- x_lab
string, the x axis label. Default is the sting passed into
x_val.- title
string, the title of the plot to be displayed on top. Default is
"".- legend_lab
string, the legend title. Default is
color.- fit
string,
single,grouped, ornone. When usingsingle, the model is fit to the entire dataset displayed on the plot. Whengroupedis used, a separate line is fit to the groups defined bycol_val. Whennoneis selected, no line is being fit. Default isnone.- discrete
boolean,
TRUEapplies a discrete color scale,FALSEapplies a continuous color scale. Default isTRUE.- linecolor
string, the color of the fitted line in
singlemode. Default isblack.- pointcolor
sting, the color to use for points when
col_val = NA.Default isblack.- corr_method
string, the correlation method to pass into
stat_cor(). Default ispearson.- alternative
string, the alternative to pass into
stat_cor(). Default istwo.sided.- fit_method
string, the fitting method passed into
geom_smooth(). Default isglm.- se
boolean, when
TRUE, the confidence interval around the fitted line is displayed. Default isFALSE.- labels
vector, the legend annotations. Default is the unique values in
y_val.- formula
string, the formula to use for fitting the line with
geom_smooth(). Default isy ~ x.- pointsize
num, point size passed into
geom_point(). Default is1.- point_alpha
num, point opacity passed into
geom_point(). Default is1.- display_n
boolean, if
TRUE, the plot displays the sample size appended to the title. Default isTRUE. The sample size is calculated on the basis of the number of rows in the data frame, so ensure that the observations indataare unique before callingscatterplotter.- facet_val
string, the name of the column to facet by. Default is
NA.- ...
other parameters passed into
stat_cor()orfacet_wrap().
Examples
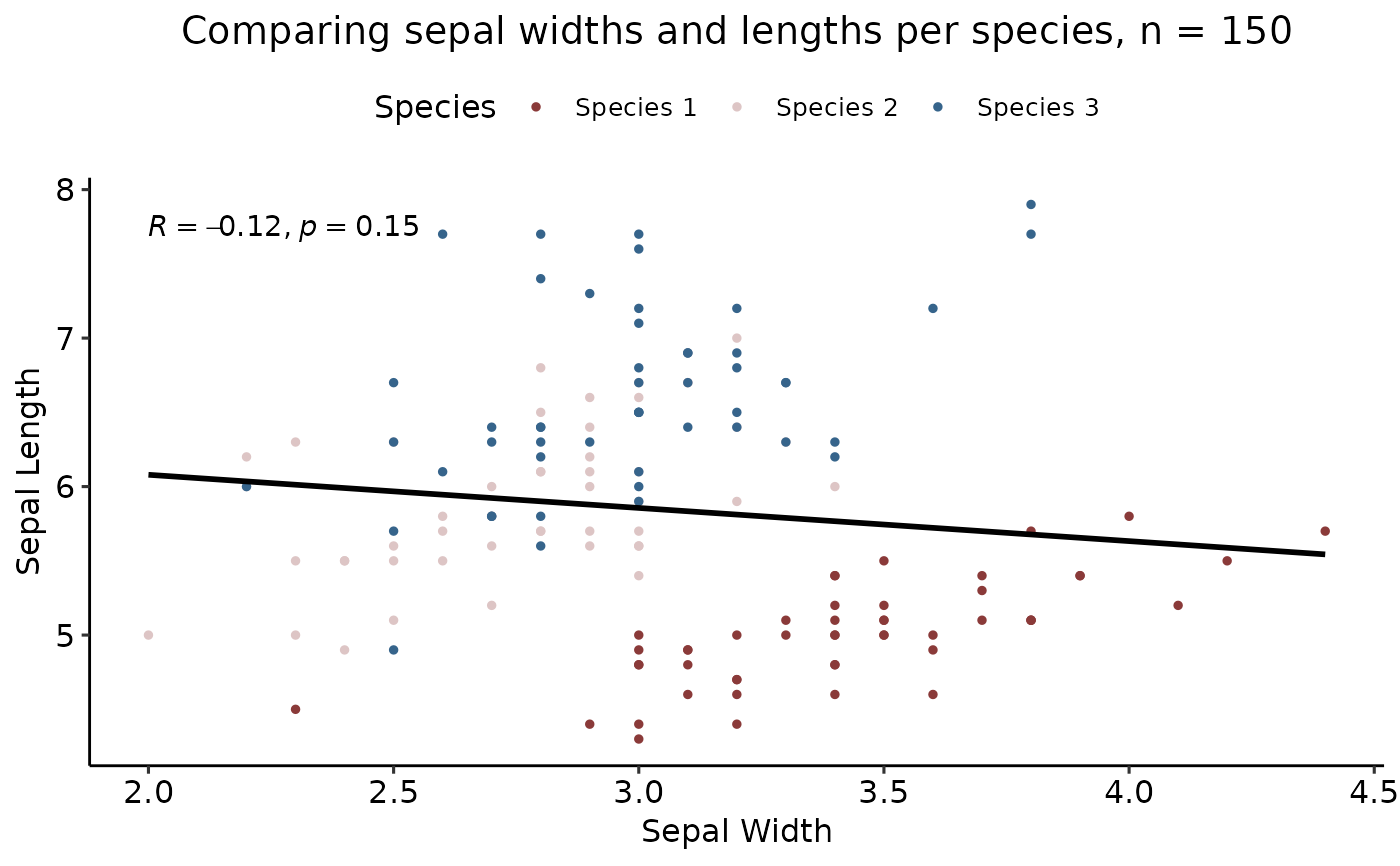
scatterplotter(iris, "Sepal.Width", "Sepal.Length",col_val = "Species", style = "tracerx",
y_lab = "Sepal Length", x_lab = "Sepal Width",  title = "Comparing sepal widths and lengths per species",
fit = "single", corr_method = "pearson", legend_lab = "Species", se = FALSE,
labels = c("Species 1", "Species 2", "Species 3"))