Create barplots
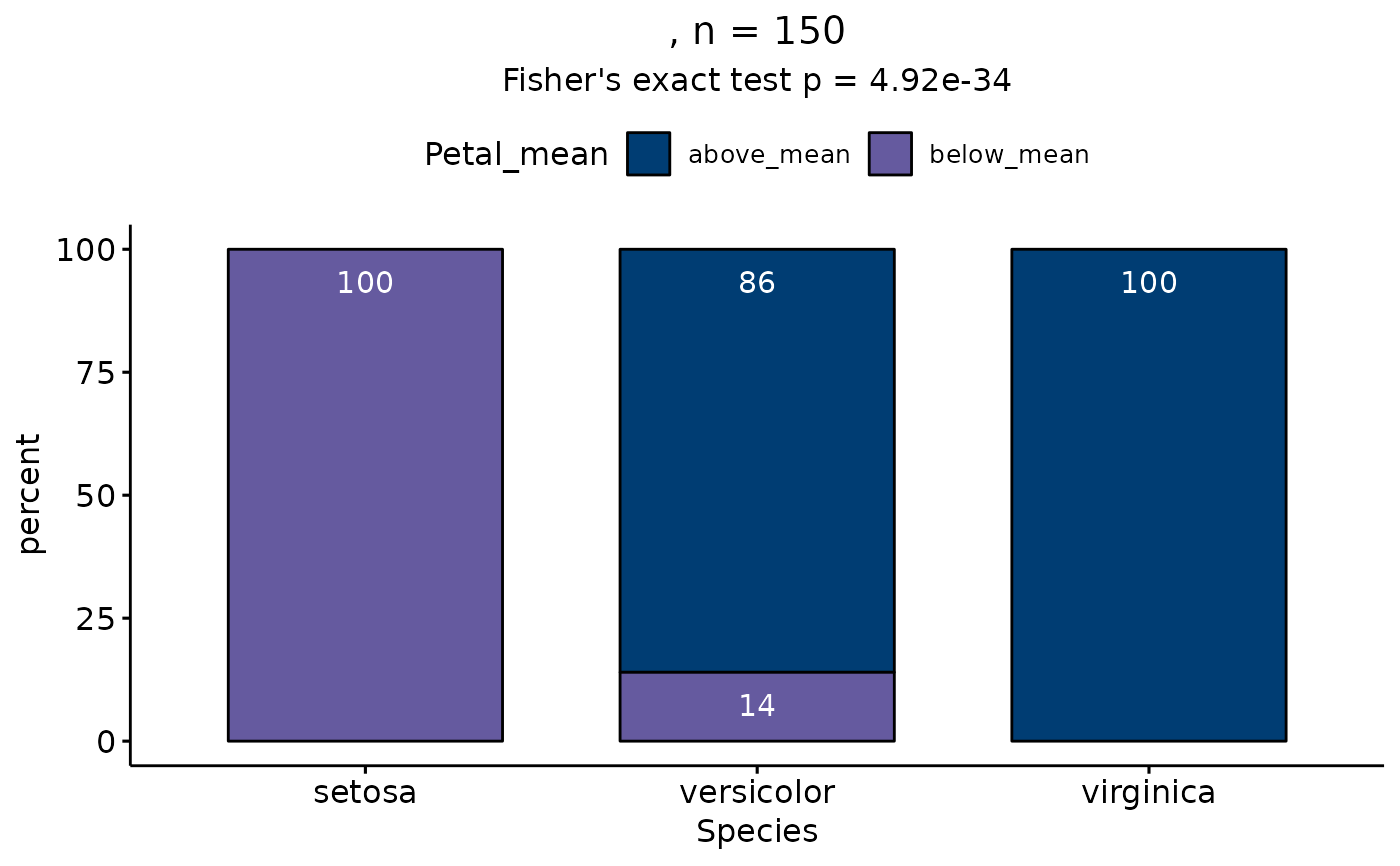
barplotter.RdEnables the creation of barplots in a convenient and customizable manner, and calculates the associated Fisher's test p-value on the count data.
Arguments
- data
The
data.frameto be used for the visualization.- x_val
string, the name of the column to plot on the x axis.
- y_val
string, the name of the column to plot on the y axis.
- order
vector, the order in which the bars should appear. It should include all unique values in
x_valin the desired order. If unspecified, the bars follow the order of the dataframe.- scale_labs
vector, names to display on the x axis ticks. By default, it shows the names as they appear in
x_val.- pct
boolean, if
TRUE, percentages are displayed on the bars, ifFALSE, the absolute numbers are shown.- style
string, palette style to be used for
scale_fill_au. Default islight. Style is only applied ifcolorsremainsNA.- colors
vector containing the colors to be used for the
fillaesthetic. Default isNA. If unspecified, the function usesau_colors().- y_lab
string, the y axis label. Default is
percent. Ifpct = FALSE, the default isnumber.- x_lab
string, the x axis label. Default is the string passed into
x_val.- title
string, the title of the plot to be displayed on top. Deafult is
"".- labcol
string, the color of the annotation numbers displayed inside the bars. The default is
black.- display_n
boolean, if
TRUE, the plot displays the sample size appended to the title. Default isTRUE.- legend_lab
string, the legend title. Default is the string passed into
y_val.- labels
vector, the legend annotations. Default is the unique values in
y_val.- filter_col
string, the name of the column to filter
databy. Default isNA.- filter_val
string or list, the entries to keep in
filter_col. Default isNA.